

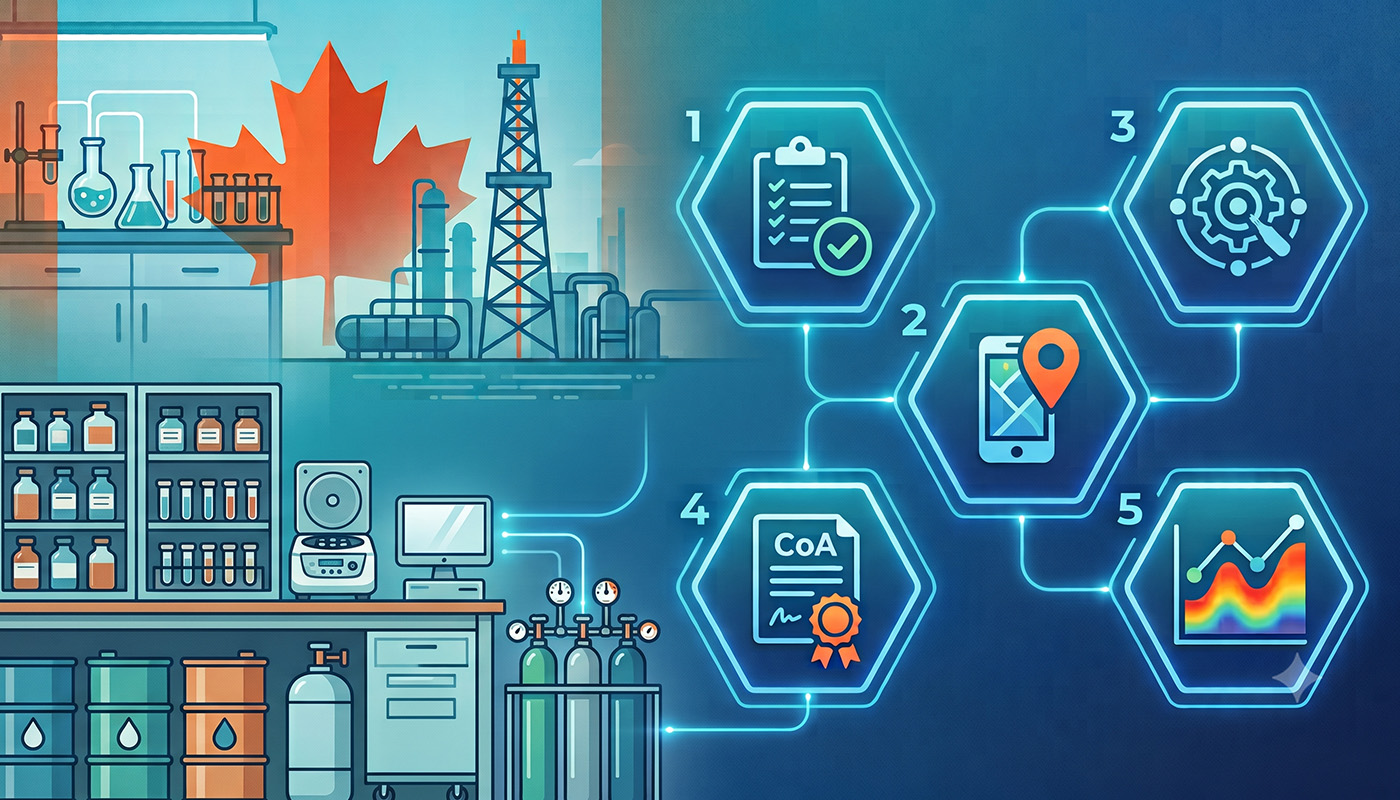
Canadian energy and chemical producers face a dual challenge: stringent regulatory scrutiny (the Alberta and Canada energy regulators, Environment and Climate Change Canada, ISO/IEC 17025) and continuous pressure to reduce operational expenditures and speed up sample turnaround times.
Full-scale enterprise Laboratory Information Management System (LIMS) overhauls often suffer from long implementation cycles and scope creep. But, you don’t need a multi-year IT transformation to see measurable value. Focusing on targeted, high-return quick wins delivers immediate labour savings, tighter compliance, and improved operational agility.
This blog post gives you five immediate actions to improve data standardization, capture, execution, and visualization in your energy or chemical laboratory (or any laboratory).
Quick Win 1: Automating Standard Workflows and Regulatory Compliance
The rise of digital reference standards is making this quick win a no-brainer. ASTM, NIST and ISO offer a variety of digital resources to make automating workflows and compliance checks much easier.
Your analysts are likely to spend hours manually cross-referencing standard testing methods and formatting compliance reports. When you implement preconfigured Laboratory Execution System (LES) workflows for core ASTM test methods (e.g., density, flash point, sulfur content, viscosity), you can alleviate that time burden.
Key Benefits:
- Ensures step-by-step adherence to SOPs and ALCOA+ data integrity principles.
- One-click, audit-ready reports tailored to Canadian environmental and energy governing bodies.
- Immediate reduction in analyst training time for routine testing procedures.
Quick Win 2: Direct Instrument Interfacing (Eliminating Manual Data Entry)
This one comes up on everyone’s list of fixes, and it has an outsize payoff. Manual transcription of results from bench instruments (GCs, titrators, mass spectrometers) into spreadsheets or paper logbooks is slow and carries human error risk.
It can be relatively simple to connect high-volume laboratory instruments directly to your LIMS via bidirectional interfaces.
Key Benefits:
- Automatic data capture from raw file exports directly into sample records.
- 90%+ reduction in manual data entry errors.
- Faster sample turnaround time (TAT) to notify refinery or processing leads of batch quality.
{{cta:the-connected-lab-a-comprehensive-guide}}
Quick Win 3: Mobile and Field Sample Tracking for Remote Operations
Canadian upstream wellheads, pipelines, and other remote sites rely on manual paper chain of custody (CoC) documents, causing delays and misplaced sample metadata during transit.
To counter this constraint, most LIMS, including SampleManager, can now work with mobile sampling apps with offline capability and barcode/QR scanning at field collection points.
Key Benefits:
- Field technicians log sample coordinates, temperature, and collection metadata in real time.
- Digital CoC eliminates lost paperwork and sample logging delays at central labs.
- Real-time visibility into samples in transit from remote operations.
Quick Win 4: Instant Specification Checking and Automated Certificate of Analysis (CoA) Generation
Having to wait for manual QA sign off and CoA formatting is a major contributor to delayed finished product release (natural gas liquids, refined fuels, specialty chemicals). This quick win produces immediate efficiency gains.
Configure the LIMS to provide automated product specification matching with color-coded pass/fail alerts and template-driven CoA generation. This is something that an experienced LIMS developer can do for you in a few hours.
Key Benefits:
- Immediately flag out-of-specification (OOS) results before product is transferred or shipped.
- Auto-generated, customer-facing CoAs upon final lab approval.
- Shorter billing and shipping cycles, unlocking faster cash flow.
Quick Win 5: Automated Process Trend Analytics and Heatmaps for Pre-emptive Quality Control
Historical lab data lives in silos, forcing chemical and refinery engineers to wait for batch failure reports or manually plot trends in Excel to spot process degradation.
There’s a relatively easy way to bypass this, too. Implement prebuilt visual trend dashboards—including data visualizations like heatmaps, moving-average control charts, and multi-parameter overlay plots—fed directly by live LIMS data.
{{cta:data-visualization-for-starlims-advanced-analytics-vs-crystal-reports}}
Key Benefits:
- Immediately highlight when product parameters (e.g., sulfur levels, viscosity, moisture) are drifting toward the upper spec limit before a batch fails.
- Plant operations and process engineers get clear access to lab data without needing database queries or LIMS export training.
- Instantly flag recurring analytical outliers linked to specific lab instruments or upstream processing units.
Immediate Benefits
We’re not suggesting you need to rebuild your lab tech stack overnight. That should be a long-term goal to get your lab data ready to use AI. In the meantime, prioritizing these five quick wins yields immediate ROI, higher compliance confidence, and happier lab staff.
Which of these quick wins would make the most difference to your lab?



.jpg)
.png)
Comments