


When you hear "dashboard" many think of the instrument panel of a car in front of the driver that provides the status of the different systems (transmission, cooling system, fuel system, engine, etc.). Within the laboratory, a Laboratory Information Management System (LIMS) can have a dashboard too. After implementing them, LIMS dashboards can provide valuable information to help manage the LIMS, the lab operation, and the lab data and information; just like the instrument panel of a car that provides the driver the status of the car being driven. The LabWare LIMS� dashboard, in combination with their visual workflow solution, however, can expand the value of your dashboard to include the simplifying of complex lab/business processes and easy access to critical LIMS functions, all at your fingertips.
Many organizations implementing a LIMS have the misconception that dashboards are "nice to haves" because, while they look great, they do not really offer any additional information than what can already be accessed within the LIMS. What these organizations are forgetting is the practical side of LIMS dashboards. Yes, the same information is presented within the dashboard, but getting to that information and displaying it easily and in a timely fashion in a format that is configurable for each LIMS user is really a "must have" in today's busy lab organizations. And when you add in the capabilities that LabWare's Visual Workflows offer, the benefits your LIMS dashboards can provide will really blossom.
Benefits of a LIMS Dashboard:
On any particular day, a Lab Analyst may report that some expected samples never got logged into the LIMS. The LIMS administrator will need to check in various places within the LIMS to see if they can figure out what happened. If a dashboard had been implemented showing the status of the Schedulers within the system, LIMS administrator will know a particular scheduler is down and its scheduled task (to log samples) has not been completed. The LIMS administrator can be well on the way to resolving the problem before the Lab Analyst officially reports the issue.
Other benefits of LabWare Dashboards and Visual Workflows include:
- When a lab analyst can easily follow a workflow provided in a dashboard and know they are performing their tasks in accordance to the required business/lab process.
- When LIMS users are able to view their daily (or weekly) workload within the dashboard at the beginning of their shift and review their previous end of day status.
- When lab managers can have real lab data provided at a glance without having to generate reports.
In other words, LabWare LIMS Dashboards and Visual Workflows provide users a friendly view into the information contained within the LIMS while increasing their efficiency and enhancing their LIMS experience and lab productivity.

Examples of LIMS Dashboards:
Dashboards prove advantageous for various roles in an organization. Below are a few of those roles and how they can utilize dashboards.
LIMS Administrator Role
Some helpful information on a System Support Role dashboard includes:
- System Peak Times
- Background Servers Status
- Scheduler Status
- Workstation Lookup
- Add/Modify User
- Update Label Printer
An example of a chart within a LIMS Administrator dashboard is shown in Figure 1, below. The chart shows the number of users currently logged into the LIMS. From this information the LIMS Administrator will be able to gauge how the LIMS is performing. If the number of current users is approaching the licensing threshold, then the LIMS Administrator will know that the LIMS needs additional licenses to support the organization.

Figure 1 -System Peak Times
Lab Analyst Role
Below are some key functions a Lab Analyst might find useful on their dashboard:
- Sample Creation
- Sample Reception
- Result Entry
- LOD
- Reviewing
- Releasing
- Manager
- Manage Instruments
- Manage Reagents
- Operation Reports
- Instrument Loading
- Overdue Samples
- Analyst Reports
- Certificate of Analysis
- Lot Summary Report
Creating a dashboard to automate a business process allows the scientists to follow the process without wondering what the next step is. From this dashboard the Lab Analyst can easily follow the process (in this case, a lab process) to perform all his/her tasks in order to complete the sample life cycle.

Figure 2 -Example of dashboard with simple process workflow
Lab Manager Role
Below are some key functions a Lab Manager might find useful on their dashboard:
- Lot Creation
- Lot Details
- Lot Disposition
- Lot Close
- Samples Review
- Report generation
- Folder By Tasks
An example where the Lab Manager benefits from a dashboard is shown in Figure 3. As you can see, the dashboard shows a chart reflecting the current status of the samples in the lab. This information shown directly onto the Manager's dashboard will save time since this negates the need to run a manual report to see this information. The information presented in the dashboard can show the manager where any bottlenecks may be and will enable the lab manager to allocate his/her personnel effectively.
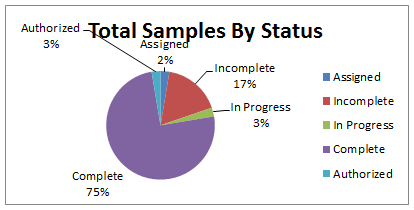
Figure 3 -Samples Review
Implementing dashboards is not necessarily simple, especially if the organization does not have expertise with the LabWare LIMS Dashboards and Visual Workflows. However, with a LabWare LIMS and domain expert leading the way, an organization can rest easier knowing the dashboards will have been implemented in an optimal manner and that they will provide maximum efficiency and security. When these dashboards are implemented successfully, they will be an integral part of your LabWare LIMS and the organization will wonder how they ever functioned without them.
Are you still thinking of dashboards the same way now? Can your organization benefit from LabWare Dashboards and Visual Workflows?


.png)


.png)

Comments