


In today's world, analytics is more important than ever and an essential part of public health. With the ongoing COVID-19 pandemic, public and health officials need to stay current, monitor trends, and make informed decisions with every tool available, especially those using data. In this article, we present concrete examples and discuss how two seasoned analytics techniques - forecasting and heat mapping - can be reapplied in new ways that weren't available during past pandemics.
Predicting Public Health Resourcing with Forecasting Analytics
Autoregressive Integrated Moving Average (ARIMA) modeling is a popular statistical technique in time series forecasting. It involves analyzing and predicting data patterns by looking back over a specific period. The ARIMA model helps forecast almost anything with ample historical data over time. It considers the previous observations and identifies any patterns in the data. It then uses this information to forecast the future values of the series. This method has proven effective in industries like retail and finance to predict seasonal sales because ARIMA is especially useful when applied to seasonal data. Without diving into the math, ARIMA weights observations closer to the present more heavily than older ones. This algorithm can be advantageous when applied to public health if the planet recently experienced, say, a global pandemic.
Now that every digital system has global pandemic data in its recent historical records, modeling can and should be adjusted. Remember, prior to 2020 and COVID-19, the best (digital) data we humans could forecast were localized epidemics like those of Swine Flu (H1N1), Ebola, SARS, MERS, etc. This newly acquired pandemic data can benefit contemporary populations by predicting future trends in COVID-19 cases, deaths, and hospitalizations.
Here, it's important to re-emphasize that these forecasting techniques can be used to predict almost anything with enough historical data - for this blog post, we are viewing it through the lens of seasonal diseases.
Aside from disease trends, forecasting could be used to make informed decisions about upcoming public health crises beyond pandemics (e.g., climate change, population displacements, food shortages, etc.). Public health officials can then use this information to make targeted choices regarding allocating resources, such as medical equipment, staff, and hospital beds. Forecasting helps public health officials be proactive rather than reactive in responding to any upcoming pandemic(s). They can prepare and allocate resources by predicting future trends before case surges occur.
Using modified seasonal data (reflective of current real-world circumstances), you can see what modeling would look like for a public health testing laboratory. Predictive modeling could benefit public health testing labs immensely - even fine-tuning justification of resources for known recurring flu seasons. First, modern data sourcing systems (LIMS, LIS, ELN, etc.) should be in place to ensure all labs log specimens/samples digitally and as accurately as possible. Leveraging a properly installed laboratory information management system (LIMS), for example, can reduce transcription errors while maintaining an accurate, GxP-compliant laboratory with a transparent, auditable chain of custody for each analysis performed. After establishing this clear data lineage, lab leadership can leverage different analytics modeling schemas for resource planning.

Example Forecasting Models for Public Health Analytics
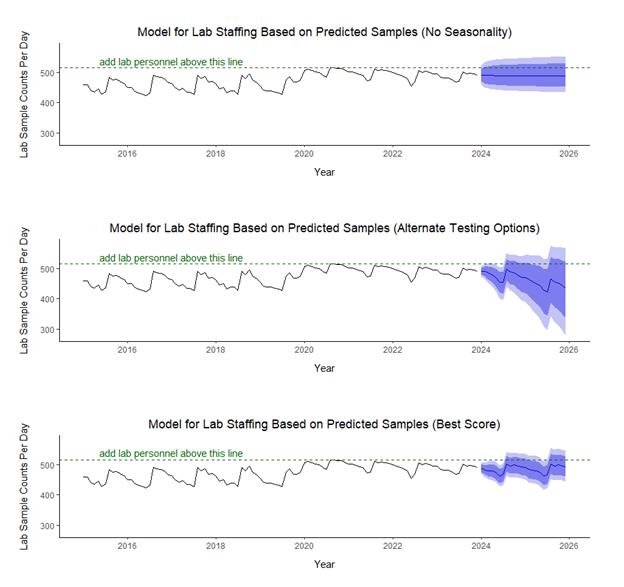
Below are several hypothetical forecasting models created using R, an open-source statistical programming language, to show what forecasts (using ARIMA) for a small public health testing lab would look like. The data was modified from the R library "fpp2" and uses the included dataset "h02" - monthly corticosteroid drug sales in Australia from 1991 to 2008. We narrowed the time window to a decade, changed the years, repurposed the counts from currency to the number of specimens representative of a small public health lab, and added a 2020 pandemic bump (i.e., COVID-19) to simulate increased lab throughput.
The resulting data visualizations are a series of forecasting models varying in performance based on possible environmental factors. They are fit to this repurposed data, which any laboratory could use to help plan upcoming resourcing. This particular example uses ARIMA modeling to help decide whether additional staffing is needed during predictable, fluctuating lab throughput seasonality (e.g., increased workload due to flu season) in upcoming years.
Public Awareness Using Heat Mapping Analytics
As an added benefit of modern digital public health data collection, trained data engineers/scientists (like those at CSols) can now construct real-time diagnostic (heat) maps for public awareness (e.g., through government websites). This tool alone could help temper new disease outbreaks. If the public knows about a norovirus outbreak at a particular location, they can avoid it or prepare for it, thereby giving the virus fewer means of transfer.
By simply combining specimen counts from a LIMS and anonymized locational data (i.e., health labs cannot disclose protected health information like street addresses in curated datasets) from an enterprise resourcing planning (ERP) system for example, a novel diagnostic tool begins to take shape. By combining only two business systems that typically remain separate - ERP and LIMS - the public could benefit from proactive, real-time data insights. Like checking the weather before running errands, we could plan around certain crowded areas spiking for a particular outbreak. Maybe we change campgrounds or leave Fido at home if our camping trip is in the path of a Lyme Disease hotspot.
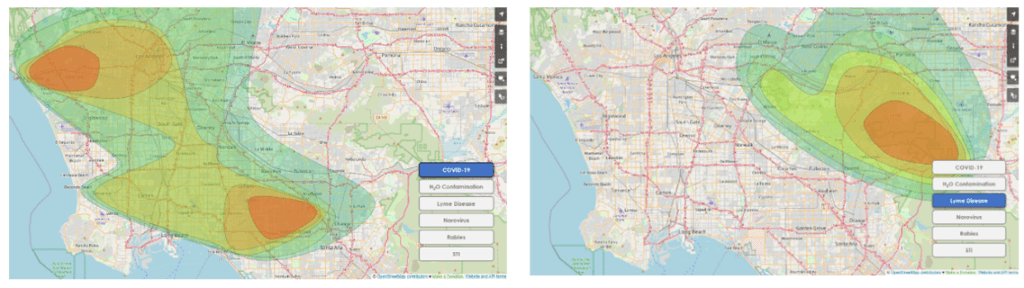
Overlaying the resulting heatmap from such data on applications like OpenStreetMap or Google Maps provides an easy-to-read data visual to help inform daily activities. In addition to public awareness, data engineers could also apply forecasting techniques (like the ARIMA example just discussed) to these visualizations to track the progress of troubled areas. Maybe diseases travel in predictable patterns like weather maps. Such an application overlay would provide intelligent planning options for the public, researchers, and officials. Local governments can then use this data to inform decisions like whether to lift restrictions and reopen businesses rather than following their gut instincts or bowing to political pressure.
In conclusion, we have arrived at a pivotal moment in history for analytics and public health. Laboratory analytical platforms like LIMS and ERP, statistical techniques like ARIMA forecasting, diagnostic tools like mapping applications, and rapid informational platforms like the Internet and social media for spreading information (true and false) have never been as advanced as they are at this current point in time.
▶ Related Reading: Four Data Visualization Tools
Combining these solutions present real-world applications for using data to make informed, proactive decisions rather than reactive guesses. Public health officials have never had such powerful tools available to allocate resources intelligently and take appropriate measures to contain outbreaks before they start.
If you had access to these data, how would you use them?

Comments